Craig Smalley, Karen Frost, Gina Bertocci
Department of Bioengineering, University of Louisville, Louisville, KY
ABSTRACT
This study assessed ramp slopes of fixed-route, public transit bus deployed ramps and compared field measurements to the proposed new ADA Accessibility Specifications for Transportation Vehicles guidelines. A ramp-embedded inclinometer was used to record ramp slope during 221 wheelchair and scooter boardings throughout a large metropolitan service region. Measured ramp slopes ranged from -1° to 14° with a mean of 4.5°. The proposed ADA guideline of 1:6 maximum slope was exceeded in 45% of cases when the ramp was deployed to street level and 2.5% of cases when the ramp was deployed to sidewalk level.
BACKGROUND
Nationwide, an estimated 2.7 million adults are wheelchair or scooter (collectively, wheeled mobility device, or “WhMD”) users (LaPlante M, 2010), and this number is expected to increase with the aging population. WhMD users must often rely upon public transit to access work, medical care, school and social activities. In 1990, the Americans with Disabilities Act (ADA) prohibited discrimination against people with disabilities in employment practices, public accommodations, and telecommunication services (Americans with Disabilities Act, 1990) and required that public transit providers accommodate persons who remain seated in their WhMD when using public transit.
Numerous studies have identified barriers to full integration and participation in society of people with disabilities associated with the lack of reliable and accessible transportation. In 2000, NIDRR reported that 82% of wheelchair users indicated difficulty using public transportation systems, and nearly 39% reported wheelchair access problems (Kaye HM, 2000). The National Council on Disability found that many people with disabilities who are willing and able to work cannot do so because of inadequate transportation (National Council on Disability, 2005). The same report found that inadequate transportation is a primary reason many people with disabilities cannot leave their homes to shop, socialize, and worship.
Difficulty using a public transit bus ramp can be a barrier to public transportation access. Frost et al. (2010a) conducted a retrospective review of six years of WhMD-related adverse incident reports maintained by a metropolitan transit agency and found that WhMD users experienced a greater percentage of incidents when using the bus ramp (42.6%) than during transit (33.9%), and 43.6% of ramp-related incidents resulted in injury. The authors subsequently conducted an observational study using video surveillance footage to assess difficulties and incidents encountered by WhMD users when accessing and traveling on public transit buses (Frost KL, 2010b). Steep ramp slopes appeared to be associated with 27.5% of ramp-related difficulties and incidents (Frost KL, 2010b).
The existing ADA Accessibility Specifications for Transportation Vehicles (Architectural and Transportation Barriers Compliance Board, 1990), shown in Table 1, state that ramps “shall have the least slope practicable”. However, as currently written it is virtually impossible to assure compliance with these ramp slope requirements given variations in the environment (e.g curb height and presence or absence of curbs) and the extent of vehicle kneeling implemented by the bus operator. In 2010, the U.S. Access Board announced a notice of proposed rule making to revise and update accessibility guidelines for buses, over-the-road buses, and vans. The Access Board proposed reducing the maximum ramp slope to 9.5° (1:6) when deployed to boarding/alighting areas “without station platforms and to the roadway” (Architectural and Transportation Barriers Compliance Board, 2010). To-date, no changes to the Accessibility Guidelines have been made.
Ramp Deployment Level |
Maximum Slope |
Ground [street] level |
1:4 |
Vehicle floor ≤3 in above 6-inch curb |
1:4 |
Vehicle floor >3 in and ≤6 in above 6-inch curb |
1:6 |
Vehicle floor >6 in and ≤9 in above 6-inch curb |
1:8 |
Vehicle floor >9 in above 6-inch curb |
1:12 |
| Note: ADA Accessibility Specifications for Transportation Vehicles, Subpart B-Buses, Vans and Systems | |
The authors previously measured ramp slope on a single public transit bus (2008 model Gillig low-floor public transit bus) to determine ramp slope during full kneeling and minimal kneeling conditions when deployed to street and sidewalk level (6-in. curb). Under minimally kneeled conditions, ramp slope measured 10° when deployed to sidewalk level and 17° when deployed to street level, exceeding both the current and proposed ADA ramp slope guidelines (Frost, 2010b).
These findings indicate that ramp slopes currently encountered by WhMD users during travel on public transit buses may exceed the proposed new ADA maximum ramp slope of 9.5° (1:6). This study provides an evidence-based approach to assessing ramp slopes encountered by WhMD users on a daily basis, for evaluation of real world data with proposed new ADA guidelines.
PURPOSE
The purpose of this study was to answer the following research question:
- What vehicle ramp slopes are encountered by WhMD users boarding a public transit bus throughout a metropolitan service region and how do these compare to the proposed new ADA guideline?
METHOD
Subjects
This study was conducted in accordance with IRB protocol #12.0098. The study population was WhMD-seated passengers traveling on a public transit bus equipped with a Lift-U Fold-Out Plus ramp model LU11.
Two hundred twenty-one WhMD ramp boardings were observed. Observations included 156 power wheelchairs (70.6%), 38 manual wheelchairs (17.2%), 25 scooters (11.3%) and 2 attendant-propelled adult strollers (0.9%). Among power wheelchairs, 64 were front wheel drive (41.0%), 72 were mid wheel drive (46.2%), and 20 were rear wheel drive (12.8%).
Instrumentation
A single public transit bus (2010 model year Gillig 40 ft. low-floor bus) was used for this study. Signs are posted in the bus notifying passengers that activities are being monitored and recorded for public safety. In accordance with the policies of the transit agency, buses are randomly assigned daily to both operators and routes throughout the service region.
The existing GE® MobileView Quattro camera system used by the transit agency for video surveillance provided incomplete views of the deployed ramp and suboptimal video quality. For this reason, an AngelTrax® MiniMicro 2-camera system was installed with one overhead view of the ramp and front interior portion of the bus and a view of the same area from underneath the bus operator’s seat. Video image resolution is 720 x 584, and frame rate is 30 frames per second (FPS), yielding 15 FPS for 2 cameras.
Ramp slope was measured using an analog inclinometer module (VTI SCA121T-D05) securely mounted within the ramp structure. This inclinometer provides a ± 90° measuring range with 0.0035° resolution. Inclinometer output was recorded at 1Hz using an Omega data logger (OM-CP-VOLT101A-15V). The data logger was located such that it was easily accessible to periodically download recorded data.
Procedure
Data was collected for nine months. Video recordings and inclinometer data were retrieved every 7-10 days for analysis and permanent storage. A FileMaker Pro database (Ver 12) was used to abstract video and ramp slope data for each WhMD boarding. Data collection included WhMD type, WhMD orientation on ramp, ramp deployment level (street, sidewalk), ramp slope, WhMD approach angle to ramp, WhMD drive wheel location, whether or not difficulties were observed while accessing/traversing the ramp, and whether or not assistance was provided to the WhMD user. Much of this data will later be used to analyze observed difficulties and incidents encountered by WhMD users when accessing bus ramps and their causes.
Data Analysis
The inclinometer output - a varying voltage based on the orientation of the sensor - was converted to a corresponding angle using a mathematical algorithm. Video files and data logger recordings of inclinometer output were both time-stamped, allowing inclinometer measurements to be synchronized with the video. For each observed ramp deployment for WhMD use, the ramp angle is thus known. Descriptive statistics were used to describe ramp slope means and standard deviations, along with the frequency distribution. Statistical analysis was performed using SPSS (Ver 19) to determine if deployed ramp slopes differed across WhMD types.
RESULTS
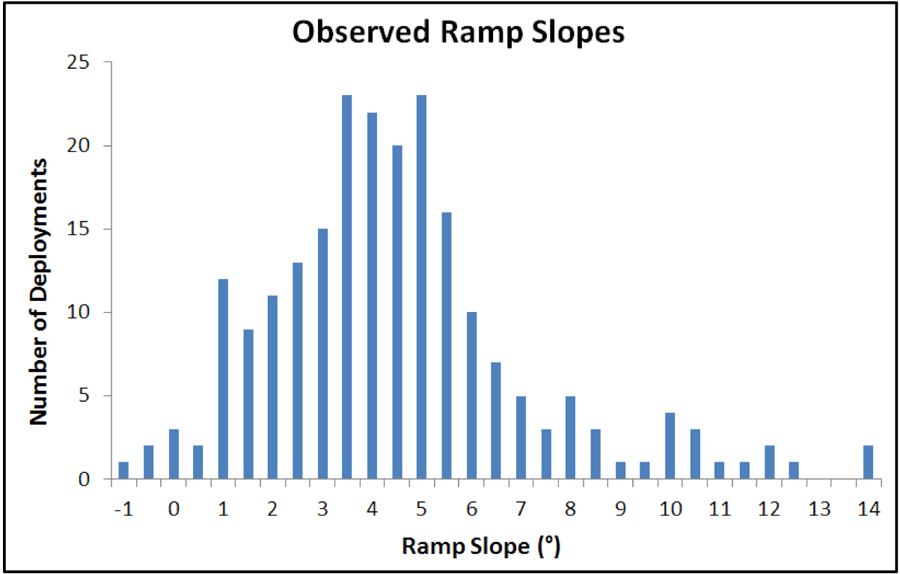 Figure 1. Frequency Distribution of Observed Ramp Slopes During Boarding (n=221)
The mean ramp slope for all WhMD boardings was 4.5° (± 2.7°). The frequency distribution of ramp slopes during all WhMD boardings is displayed in Figure 1. The mean ramp slope for power WhMDs, manual WhMDs, and scooters were 4.6° (± 2.8°), 4.2° (± 1.7°), and 4.6° (± 2.9°), respectively. Distribution of data was nonparametric as determined by Shapiro-Wilk test, therefore Kruskal–Wallis one-way analysis of variance (α=0.05) was used to test for significance. There were no statistically significant differences in ramp slope based on WhMD type (p=0.930). Ramp slopes for the two strollers were 1° and 3.5°. (Due to small sample size, stroller ramp slopes were not included in statistical analysis.)
| Slope (°) | Sidewalk Level | Street Level |
Mean (± SD) |
4.0 (± 2.1) |
8.9 (± 3.5) |
Maximum |
10.5 |
14 |
Table 2 details the mean and maximum ramp slopes observed based upon ramp deployment level. Table 3 indicates the percentage of deployments exceeding the proposed ADA maximum allowable ramp slope of 1:6 (9.5°).
| Sidewalk Level | Street Level |
2.5% |
45% |
| Note: Proposed allowable ramp slope is 9.5° regardless of deployment location. | |
DISCUSSION
Almost half of ramp deployments to street level exceeded the proposed new ADA guideline for maximum ramp slope. This finding is significant, especially given that the bus used in this study was able to achieve a 1:6 ramp slope when deployed street level. When deployed to a sidewalk with a 6” curb, this bus can achieve a 2° ramp slope, however 2.5% of ramp deployments at sidewalk level exceeded also exceeded the proposed new ADA guideline of 1:6 (9.5°).
Ramp and bus design, as well as the built environment, influence the minimum achievable slope. This bus was equipped with an interlock that prevented ramp deployment without activation of bus kneeling, but the amount of kneeling was controlled by the bus operator (Note: the interlock feature is decided by individual transit agencies and not standard in all buses).
In some instances, we observed exterior terrain that sloped away from the bus, so that the end of the ramp laid on a surface below street level. In other instances, it was visibly apparent that the operator did not fully kneel the vehicle before deploying the ramp. When deployed to a high curb with upward sloping terrain, it was possible for the exterior end of the ramp to be higher than the interior end.
Steep slopes and negative slopes are fully or partially correctable by the bus operator. We observed one operator advising a WhMD user to move to a sidewalk with a curb so that the ramp slope would be lower and easier to ascend. However, other operators were observed deploying ramps to street level when a sidewalk with a curb was available nearby.
The findings from this study suggest that WhMD users would benefit from improved training of bus operators in understanding the impact that kneeling has on ramp slope, and in identifying optimal discharge locations for WhMD users
Limitations
Observations were based on a single vehicle with a given ramp design in one service region. Varying ramp and bus designs, and geographies, may result in different ramp slopes encountered by WhMD users. Additionally, bus operator practices and behaviors vary across transit agencies. Thus these findings are not generalizable across transit agencies throughout the U.S.
On-going and Future Work
Future work will focus on detailed analysis of the influence of bus kneeling on resultant slope and establishing guidelines for preventing ramp-related difficulties and incidents.
CONCLUSION
Almost half of ramp deployments to street level exceeded the proposed new ADA guideline for maximum ramp slope. Correctable factors such as degree of bus kneeling and ramp deployment location suggest improved bus operator training is needed.
REFERENCES
Americans with Disabilities Act (1990), Accessibility Guidelines for Transportation Vehicles. 36 CRF Parts 1192.
Frost KL and Bertocci G. (2010a), Retrospective review of adverse incidents involving passengers seated in wheeled mobility devices while traveling in large accessible transit vehicles. Medical Engineering & Physics 32(3): 230-236.
Frost KL, Bertocci G and Sison S. (2010b), Ingress/egress incidents involving wheelchair users in a fixed-route public transit environment. J Public Transportation 13(4): 41-62.
Kaye HM and Laplante M (2000), Mobility device use in the United States. Washington DC, U.S. Department of Education.
LaPlante M and Kaye H M. (2010), Demographics and trends in wheeled mobility equipment use and accessibility in the community. Assistive Technology 22: 3-17.
ACKNOWLEDGEMENTS
This study was funded by the National Institute on Disability and Rehabilitation Research (NIDRR), Field Initiated Projects program, Grant #H133G110074 The opinions expressed herein are those of the authors and do not necessarily reflect NIDRR opinions.